Personalization Measurement Loops and Holdout Test Design
Shared learning models require tiered holdouts to measure personalization lift accurately.
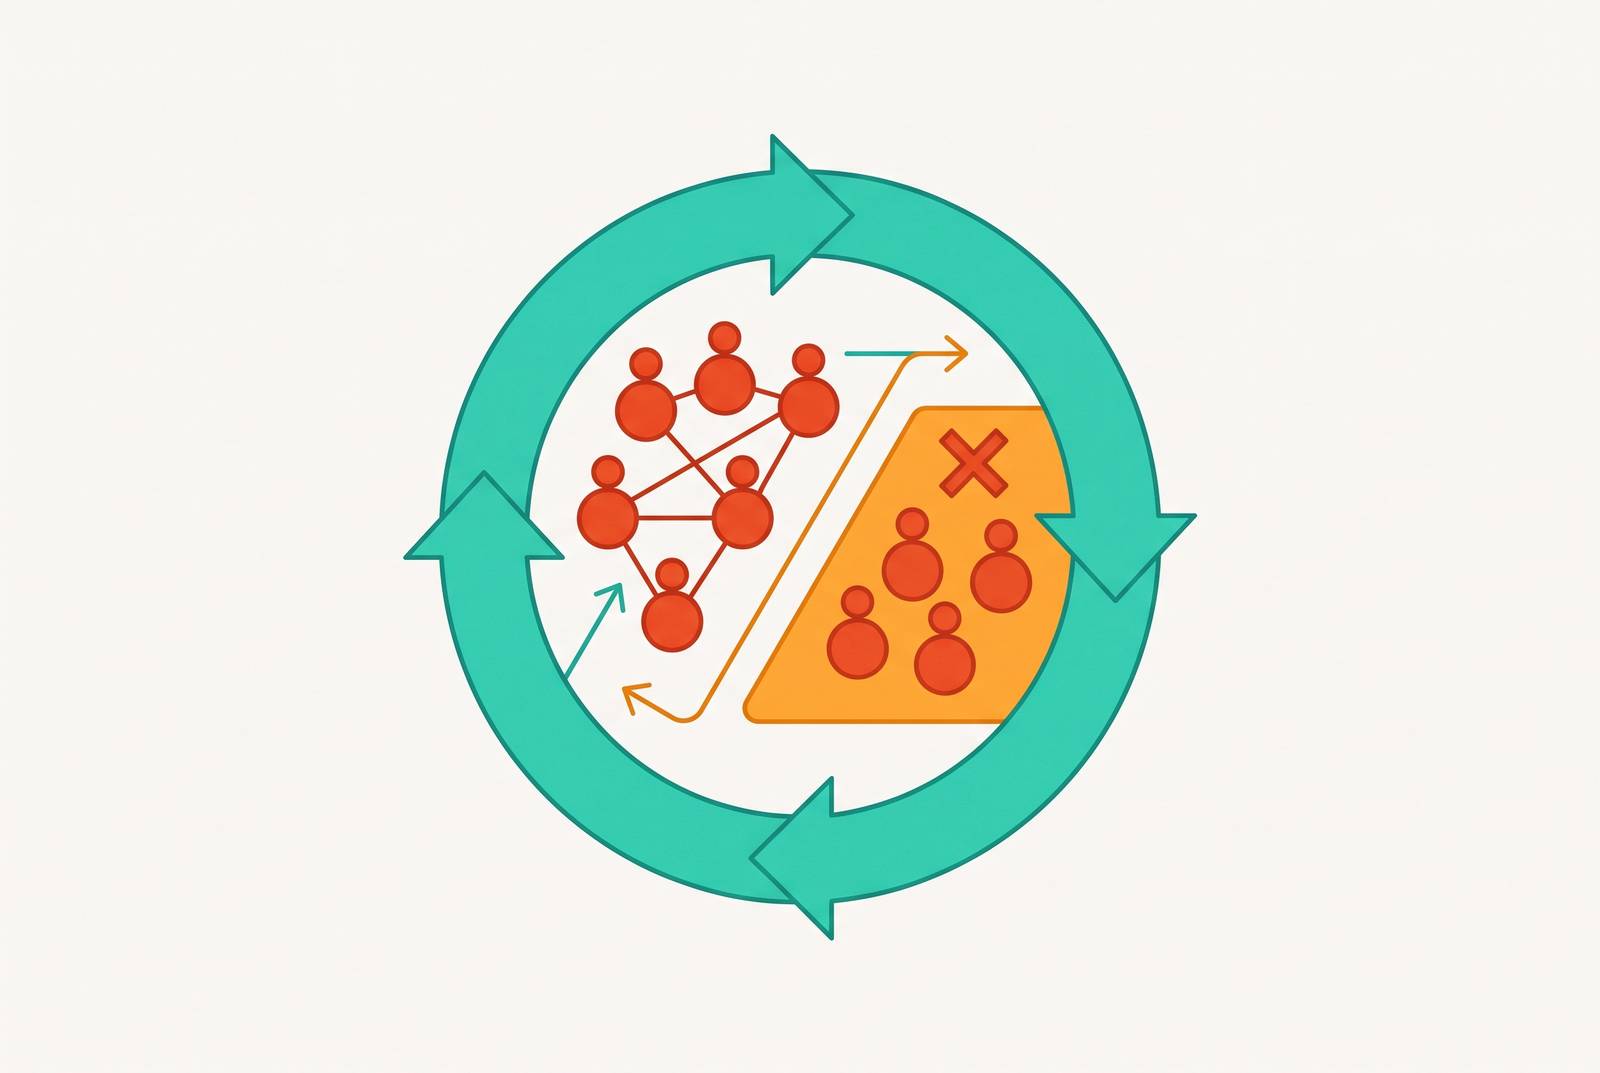
Personalization measurement depends on whether a holdout represents life without the treatment. In a system that learns from shared behavior, withholding a feature does not necessarily withhold its effects. For measurement to be trusted, it needs tiered holdouts, controls that account for spillover, and checks on the paths that personalized signals take to reach users. Without that discipline, lift numbers cannot reliably support feature decisions or strategic investment.
Why standard holdout tests were not built for personalization systems
In a drug trial, one participant receiving treatment does not ordinarily change what another participant receives. A static ad campaign offers a similar intuition because users do not share a model that learns from each other’s behavior. Classical holdout logic rests on that separation. The Stable Unit Treatment Value Assumption (SUTVA) states that one user’s treatment assignment does not affect another user’s outcome. Standard user-level, geographic, and time-based holdouts rely on this independence.
Personalization systems break that assumption by design. Through collaborative filtering, session-level embeddings, and shared knowledge graphs, what treatment users do shapes what holdout users get. Treatment users give the model richer interaction signals, with more precise implicit feedback, longer consumption sequences, and better negative-sampling ground truth. Those signals feed into retraining, which changes the recommendations that every user gets, including users in the holdout.
As the graph becomes denser, the opportunities for treatment signals to shape holdout experiences increase. A clean assignment between groups does not, by itself, create a clean boundary between their outcomes. The experiment can be correctly randomized while its control no longer represents the condition it was intended to measure.
How the contaminated control group systematically understates personalization lift
When model updates based on what treatment users do help holdout users too, the control baseline rises. That upward drift compresses the measured gap between treatment and control. The resulting estimate understates personalization’s effect.
That distortion has a concrete cost for product and infrastructure decisions. Features capable of compounding into durable retention lift can look weak within a two-to-four week window, when the model is least trained. Teams may cut those features before they can see their value. Infrastructure investment can likewise be deprioritized because its measured return appears marginal. In both cases, the decision treats a contaminated comparison as evidence of limited value.
Short windows introduce two further distortions, which do not necessarily point in the same direction. Novelty inflation occurs when treatment users interact more simply because something changed, lifting engagement for one to two weeks post-launch regardless of feature quality. Preference refinement can lead to the opposite pattern as users learn what they really prefer more quickly and become more choosy. Initial engagement volume may fall even as quality and retention improve, so a two-week window captures the dip and misses the plateau. Spillover systematically compresses lift, but these timing effects mean the reported short-run number is not necessarily a clean lower bound.
What rigorous incrementality measurement is actually asking — and why before/after comparisons cannot answer it
Attribution assigns credit to touchpoints that preceded a conversion, while incrementality asks whether treatment caused an outcome that would not otherwise have occurred. Apollo’s B2B uplift framework defines personalization uplift as incremental revenue or pipeline generated against a comparable control. A successful conversion is an outcome to explain.
Before/after comparisons cannot isolate that cause because pricing adjustments, product updates, and campaign shifts can change during the same period. Such comparisons provide directional evidence at best and can be actively misleading. A credible counterfactual instead represents what would have happened without the treatment. BCG’s NBA measurement framework identifies a related problem with last-touch attribution, which awards full credit to the action before conversion regardless of causation. Because personalization models choose customers who are already likely to convert, attribution can treat selection effects as treatment effects.
The four holdout structures available and what each one can and cannot answer
The design choice depends on the question, the available budget, and the operational constraints. User-level holdouts separate users into treatment and control, making them useful for comparing personalized and non-personalized experiences. Their limitation is the shared learning already described, since separate assignments do not prevent model-mediated spillover. In B2B settings, the unit of assignment creates another constraint because buying decisions involve multiple stakeholders. Apollo’s B2B uplift framework specifies account-level controls rather than individual-user randomization for that context.
Geo holdouts use matched markets, splitting regions into test and control and blacking out advertising in control regions. They suit cross-channel incrementality questions and full media blackouts. They need enough spend per channel and markets that have been carefully matched. A geographic boundary changes the unit of comparison, but it does not remove the need to examine whether treatment can affect control outcomes. The design’s credibility still depends on what separates the regions in practice.
Time-based on/off tests run ads or features and then turn them off, comparing conversion rates across periods. They are feasible at small budgets and can serve as a sanity check. They are also the weakest design because seasonality, organic momentum, and fatigue contaminate the comparison. Sequential testing offers a related fallback for smaller audiences by running generic messaging and then personalized messaging on the same audience, using time-series regression to isolate lift. That makes it pragmatic when a holdout is difficult.
MMM-validated matched markets use media mix modeling to design holdout regions as synthetic counterfactuals. They are most appropriate for large brands running quarterly measurement cadences. Their requirements include historical data and investment in modeling. These four structures are therefore not a ranking from universally best to worst.
Why a single holdout tier is still insufficient — and how the two-tier architecture addresses spillover directly
A per-experiment holdout supports immediate feature decisions, but it cannot establish the compounding value of the personalization system. Its control baseline can also drift as the shared model learns from treatment users. Extending the interpretation of that experiment from one feature to the whole stack therefore asks it to answer a question it was not built to resolve.
A two-tier architecture separates those jobs. The per-experiment tier lets teams iterate quickly, while the global tier gives them a long-run signal to guide infrastructure investment and how they set strategic budgets. These tiers must coexist because neither question replaces the other. The architecture aligns the comparison with the decision it must support.
That separation addresses spillover only when the controls also respect the system’s connections. The intuition behind graph-community-ID grouping is to cut at the seams of the social graph. In general, grouping connected users makes the boundary of the experiment better reflect the paths through which their behavior can affect one another. It is not a guarantee that all cross-group influence disappears. The two-tier design gives each tier its own measurement role, but teams can trust those roles only when they use spillover-aware boundaries and deliver the control as planned.
Three layers where data leakage undermines even well-designed holdouts — and how to validate each one
The feature store is the first validation layer. Holdout users must not receive personalized features, including through cached results. Cached recommendations built for a treatment user can populate a holdout experience if the cache key is not holdout-aware. Teams must therefore check both what the cache delivers and the features that are newly generated. Otherwise, a correct assignment can still lead to a personalized experience through stored output.
The recommendation API is the second layer. Its routing logic must keep holdout users separate from the production model by sending them to control logic. A misconfigured flag can break that separation, as can a fallback path that defaults to the live model. The audit must therefore cover both the intended control route and the fallback behavior.
Tracking and attribution form the third layer. Conversion events must reflect the user’s holdout status at the time of conversion. When users move between groups during a test window, or events are logged against the wrong segment, the comparison of outcomes goes wrong. Hello Retail’s personalization ROI framework points to a similar risk when A/B tests run at the same time and their audiences overlap. Testing one personalization strategy at a time avoids stacking changes whose effects cannot be cleanly attributed.
The organizational resistance that prevents holdout discipline from being adopted — and the measurement maturity model that frames the stakes
Maintaining a holdout means deliberately withholding personalization from some customers. That creates an opportunity cost for business teams accountable for short-term revenue, even when they accept the measurement logic. BCG’s NBA measurement framework describes the need to weigh that revenue cost against the value of reliable evidence. It also identifies resistance from business units targeting the same customers, which may be unwilling to suspend outreach even when a test could show that the program adds no value. Adoption therefore requires a management decision about what uncertainty the organization is willing to tolerate.
BCG frames measurement maturity across three levels. Level 1 uses campaign metrics, including response rates, conversion rates, and last-touch attribution. It identifies engagement but not incrementality, limiting the questions it can answer to operational matters such as creative execution. BCG places the vast majority of organizations at this level. Remaining there means accepting that evidence of response will not establish whether the program changed behavior.
Level 2 introduces randomized holdout groups, structured A/B tests, and program-level causal measurement. It begins to answer whether a program changed behavior relative to doing nothing. Reaching that level requires accepting the organizational cost of withholding treatment from a control group. BCG’s research finds that a meaningful share of active programs deliver marginal to negative lift because they redirect existing demand. The short-term sacrifice buys the ability to distinguish incremental demand from demand that would have converted anyway.
Level 3 adds the use of agent-interpreted evidence, agent-generated explanations, and agent-executed optimization. The human role shifts from interpreting and deciding to reviewing and governing. However, this level requires Level 2 infrastructure as its foundation. Automating the use of evidence does not repair an invalid comparison. For finance and marketing leaders, the progression is a choice about which business questions the organization can answer.
What CFO-ready incrementality reporting requires beyond a lift number
A lift number cannot carry a finance review without the design that supports it. Apollo’s B2B uplift framework specifies matched account or user controls. Those groups must be demonstrably comparable on the dimensions that predict conversion. Confidence intervals must accompany point estimates so that the report communicates uncertainty rather than presenting a single number as settled fact. Together, those elements explain both the basis of the comparison and the precision of the result.
Apollo’s framework calls for revenue-stage KPIs, which in B2B include account progression rates, opportunity creation rates, and deal velocity. Negative personalization outcomes belong beside conversion lift because buyer overwhelm, opt-outs, and purchase regret reveal damage the conversion dashboard may miss. Omitting them overstates the net effect. Finance-ready reporting must describe the value created and the costs that qualify it.
The output must then map to the decisions it supports. Strategic decisions concern where to invest, tactical decisions concern what to invest in, and operational decisions concern how to improve execution. BCG’s NBA measurement framework establishes that a global holdout, or 'Big M' measurement, is needed to answer whether the entire NBA program creates value. Operational metrics alone cannot justify that strategic allocation. People in the organization can trust measurement when its numbers hold up under checks from finance and help them discuss the budget.