Competitive LLM Share of Voice Reporting Your Ops Stack Can Actually Automate
Three inputs let your existing ops stack automate competitor mention tracking.

Competitive LLM share-of-voice reporting shows which competitors AI assistants name in place of your brand. It needs three inputs built for the job, a prompt library, multi-platform runners, and a structured mention log. Once connected, those inputs let the scheduling, storage, and reporting tools most marketing teams already use automate the reporting cycle, turning a manual audit into a repeatable competitive benchmark.
Why traditional share-of-voice tooling cannot measure LLM visibility
Traditional share-of-voice tools measure countable surfaces, including keyword positions and ad placements. AI answers change the unit being counted. Instead of asking whether a page ranked, the measurement asks whether a brand appeared in a synthesised answer. That answer can change between runs of the same prompt, so visibility becomes a distribution of mention frequencies.
The differences do not stop at variability. A brand can dominate ChatGPT and be invisible on Gemini in the same week, while a blended score conceals the split. An answer can also name a brand without citing its domain, or cite the domain without naming the brand. A rank tracker cannot capture those distinctions by acquiring a new dashboard and a hopeful attitude. Ops teams need three inputs that classic tools never had to handle.
The three inputs that define the LLM SOV measurement architecture
The prompt library defines which buyer questions enter the benchmark. Its scope includes the category terms, competitors, and query types being measured, so the results describe “AI visibility” in a specific competitive market. The platform runners then submit those prompts to the selected assistants on a recurring schedule. The mention log stores what is in each response.
Each input depends on the other two. A narrow library biases even perfectly executed runs, while inconsistent runner settings make a clean log faithfully record an unfair comparison. A log without stable identifiers leaves reporting dependent on someone assembling the pieces by hand. The results should show where brands appear, how often, and which other brands appear with them.
What to measure once the inputs are running: the three SOV formulas and when to use each
Mention-based SOV divides a brand’s mentions in answer prose by total brand mentions across the selected competitive set. It answers the most direct competitive question. When assistants name brands in this category, how much of that attention goes to this one? Use it as the main competitive reporting measure because its denominator is easy to explain. Lock the competitor set before the first run, since changing it changes the meaning of the percentage.
Citation-based SOV divides the brand domain’s cited appearances by total citations. That denominator includes third-party publishers and competing vendors, so citation share can look much lower than mention share. Position-weighted SOV gives more weight to mentions that come earlier or stand out more, using weighted brand mentions as a share of weighted competitive mentions. Being named first is not the same as appearing in an aside. Applied to the same responses, these measures describe attention, source use, and prominence.
Keep absolute visibility separate from competitive share. Mention rate uses the total number of responses as its denominator, while competitive SOV uses the total number of mentions across the chosen brands. Report presence, position, and sentiment separately too, so a rising aggregate cannot hide worsening framing. Presence shows whether the brand appears at all, position shows where it appears, and sentiment records favorable, neutral, or negative treatment. A frequently criticised brand does not have the same problem as an absent one.
Building the prompt library that makes the measurement valid
Include three to five direct competitors and, for a B2B vendor, a cluster of two or three closely related category terms where appropriate. Then draft prompts across informational, comparison, recommendation, problem-first, and use-case queries. A library made entirely of comparisons measures visibility only for comparison queries.
Write questions the way buyers describe their needs. Vary sentence structure, specificity, and framing rather than swapping one word in an otherwise identical prompt. A problem-first question and a tool-first question can expose different model behavior even when they concern the same need. Include enough prompts per cluster that run-to-run variation does not overwhelm useful trends. The briefest possible library is not necessarily the cheapest one if it produces confident nonsense.
Assign each prompt a stable ID and version-stamp the library. When prompts change or new ones enter, start a new series instead of splicing unlike samples into one trend line. Review the library quarterly as buyer language and the competitive field shift. Between reviews, hold the sample steady. That stability lets a weekly or monthly schedule measure changes in answers.
Configuring multi-platform runners that produce consistent, comparable data
Use ChatGPT, Perplexity, and Gemini as the minimum platform set, adding Copilot when the ideal customer profile skews enterprise-Microsoft. Treat that addition as a scope decision. Each platform retrieves and presents information differently, so identical prompt text alone does not establish comparability. ChatGPT’s web-search setting needs extra care because its use of citations changes a lot when search is on. Keep that setting constant within the series.
Perplexity’s numbered citations make source-link measurement especially useful there, while citation-only reporting can understate ChatGPT visibility without web search. Repeated runs address a different source of inconsistency. Execute each prompt three to five times per platform per cycle, with three as the floor for a minimum viable weekly cadence. Use more runs for high-stakes prompts where needed, and smooth trends with rolling four-week averages.
Build runners through platform APIs where access allows. Access policies and rate limits differ, and supporting more platforms increases implementation work. Handle throttling so failed runs do not silently leave holes in the series. Scripts can write responses directly to a structured spreadsheet at small scale or a database or warehouse at recurring scale.
Structuring the mention log so it can feed automated reporting
The log needs a stable identity for every prompt-run. Record prompt text, prompt ID tied to the library version, platform, run number, and run date. The mention records tied to each run need the brand, its position in the response, a citation-present boolean, and a sentiment classification. Keep the raw response text with those structured fields. It allows extraction logic to improve without paying for a fresh round of answers.
Separate the run record from its brand-level detail. A small spreadsheet can hold one row per prompt-run, but reports that run on a schedule also need an entry for every selected competitor, with a zero when it is absent. Encode the competitor set rather than inferring it from whichever brands appeared. Otherwise, absence can disappear from the data itself. Retain citation details needed for the total-citation denominator, since a brand-level citation flag alone cannot supply citation-based SOV.
Begin brand extraction with auditable matching against the known competitor list. Exact matching misses variants and misspellings, while named-entity extraction catches more but needs to be checked. Position extraction must distinguish first recommendations, numbered-list appearances, and asides within responses labelled “mentioned. Apply positive, neutral, or negative sentiment per mention using a documented, consistent rule. With that structure, SQL queries or BI calculations can group by platform and week and compare matching prompt sets across cycles.
Wiring the three inputs into an ops stack most marketing teams already run
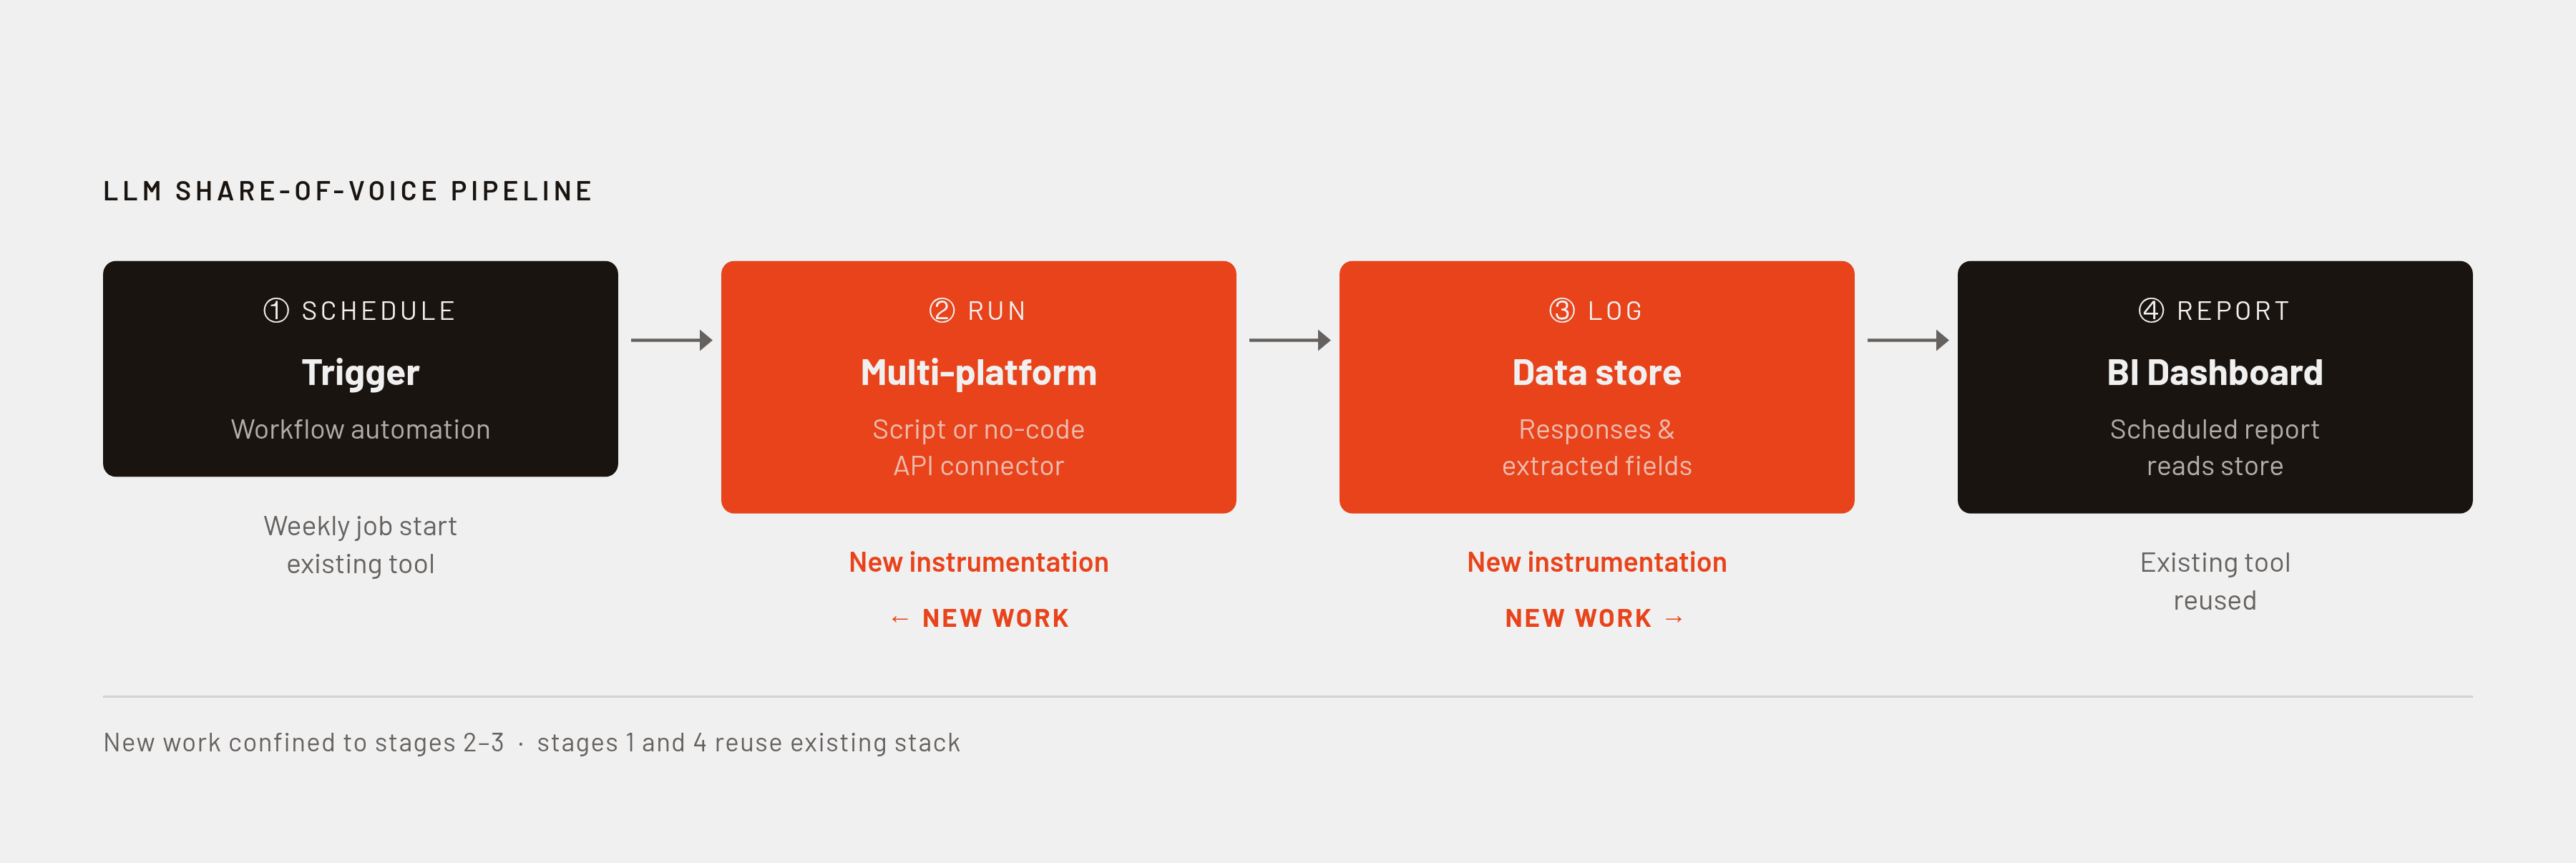
The integration has four stages, which are schedule, run, log, and report. A workflow automation tool of the kind already used for lead routing or data syncs can trigger the weekly job. That job calls a runner implemented as a script, an automation-platform function, or a no-code API connector. Responses and extracted fields then enter the existing structured data store. The BI dashboard or scheduled report reads from that store rather than waiting for someone to paste the evidence together.
Build the first version in a deliberate sequence. Lock the competitor set and keyword scope, then create the versioned prompt library with stable IDs. Run a manual baseline through incognito queries on each target platform and record it as the starting reference in the log. Next, configure the repeated automated runs and their writes to storage. Keep the platform settings the same so later results can be compared fairly.
Once collection works, schedule it weekly and add an alert for significantly fewer rows than expected. Connect the SOV calculations to the reporting layer, with the rolling four-week average as the default view. This integration project can use the scheduling, storage, and reporting tools already in place. The new work is the instrumentation that supplies them with valid observations.
Human judgment still has a defined place. Reviewing prompts quarterly helps keep the library’s coverage up to date, while sudden shifts on one platform need to be looked into before anyone rewrites the content plan. A shift may reflect model behavior, a content or PR event, or a data-quality problem. Changes to the competitor set also need deliberate approval and documentation because they alter the denominator.
What the report shows when AI assistants recommend competitors instead of your brand
The competitive report should present one row per brand, with presence rate, average position score, sentiment score, and a clearly defined aggregate SOV score. Show each platform separately as well as the aggregate. For each brand on each platform, show how much the current cycle has changed from the last one. Label the SOV formula and keep any composite calculation explicit. A CMO should not need to reverse-engineer the dashboard to learn what “share” means.
A brand with high presence but low position gets into answers without leading them, whereas a brand with low presence and strong position performs well only in a narrow slice of the sample. Negative framing introduces another diagnosis entirely. Those differences belong prominently in the report. The four-week trend helps distinguish sustained movement from an unusually flattering afternoon.
Platform divergence can guide the next investigation. Strong ChatGPT visibility but weak Perplexity visibility can suggest established corpus presence without enough current citable material, while the reverse can suggest recency without deep knowledge-base coverage. Strong results mainly on Gemini can point to Google’s content graph with less coverage across the wider corpus. Link use-case SOV trends to inbound pipeline reporting so decisions about content and PR can be judged by business outcomes as well as visibility.
Using SOV data to close the gaps the report reveals
For a presence gap, use the missing prompts as content briefs. Prioritise questions where competitors appear and the brand does not, then create content that directly addresses those query types. For a position gap, invest in authoritative, widely linked content that can serve as a primary source. Sentiment requires a different response. Look at how citable third-party sources describe the brand because changing owned copy alone leaves that framing in place.
A Perplexity citation gap calls for attention to the relevant source content. Make it current and well structured, on a domain the model treats as authoritative. Track freshness as well as share because pages left untouched can lose citations over time. When visibility is concentrated on Gemini, broader distribution beyond Google-leaning sources addresses a different kind of coverage gap.
Feed the resulting deltas back into content and campaign planning. A competitor’s sharp rise on comparison prompts is a reason to audit recent publishing and decide whether a response is warranted. A rise after the brand’s own content or PR action is evidence to track across several cycles before drawing conclusions about whether the action caused it. That distinction keeps the program useful. The payoff is a record of which interventions repeatedly align with better competitive visibility, rather than another dashboard that reports bad news with excellent typography.