Incrementality Testing Frameworks for In-House Marketing Teams
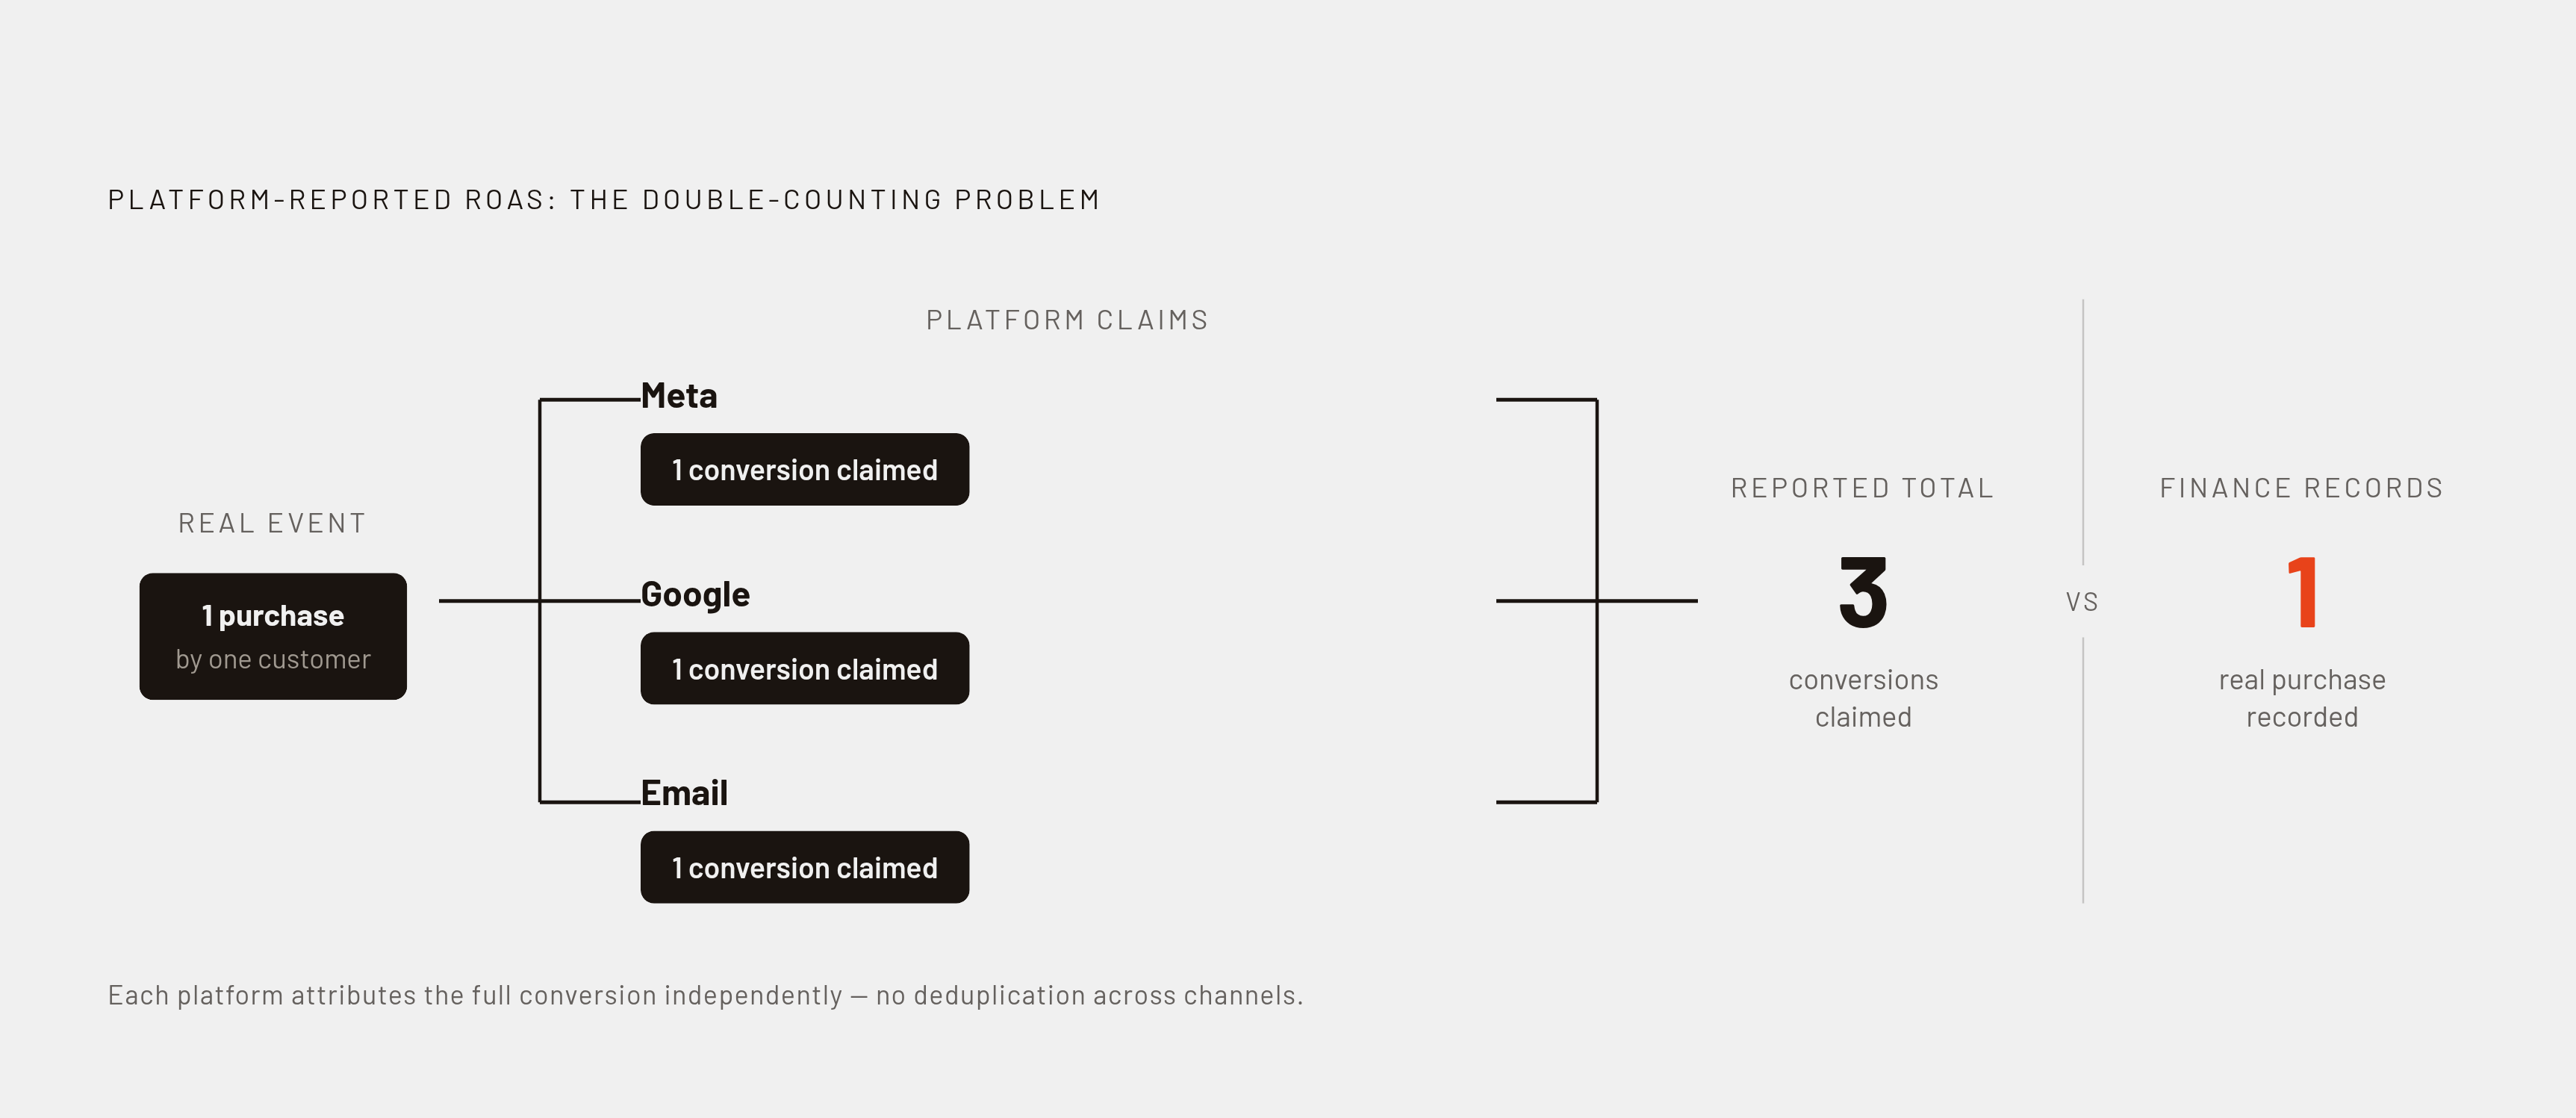
Platform-reported ROAS inflates because multiple channels claim credit for the same conversion.

Platform-reported ROAS fails because of a counting problem, not a measurement problem. Meta claims a conversion. Google claims the same conversion. An email platform claims it too. Each dashboard looks clean on its own, but add the three together and the business has paid for one customer three times over in its reporting, even though only one purchase happened.
That double-counting isn't a bug in any single platform's tracking. Each platform counts correctly within its own walls and has no way to know another platform is counting the same person. The result is a set of ROAS figures that can each be internally consistent and still sum to something far larger than the revenue the finance team actually booked. A marketing team scaling spend based on those numbers is scaling against a total that was never real.
Privacy changes have made the underlying signal worse, which has made the inflation harder to correct. Safari, Firefox, and Brave all block third-party cookies by default, cutting off a large share of the cross-site tracking that attribution models used to stitch a customer's path together. Google announced on October 17, 2025, that it would retire the core Privacy Sandbox APIs, Attribution Reporting, Topics, and Protected Audience, with deprecation starting in Chrome 144 in January 2026 and full removal targeted for Chrome 150 in July 2026. That timeline removes one of the last remaining frameworks built to let user-level attribution survive in a cookieless browser. Multi-touch attribution coverage fell sharply by 2026 as a result, and MTA now functions best as a tactical layer inside channels a team has already validated through other means.
The gap between what the platforms report and what finance can verify in the bank account has widened, and no amount of better dashboard design closes it, because the problem sits in the counting logic itself, not in the reporting layer on top of it. Incrementality testing exists to answer a different question than attribution ever could: how much of the result would have happened without the ad spend.
What Incrementality Testing Measures
Incrementality testing works by comparison, not by tracking. A group of customers sees the advertising; a comparable group does not. Whatever difference appears in conversion rate between the two groups, adjusted for statistical significance, is the lift that the advertising caused. Nothing about this method requires knowing which touchpoints an individual customer encountered. It only requires that the exposed group and the control group be alike enough that the difference between them can be credited to the ad spend and nothing else.
The core formula is simple: (Test Conversion Rate minus Control Conversion Rate), divided by Control Conversion Rate, gives the incrementality percentage. Two further metrics turn that percentage into something a budget decision can be built on. Incremental ROAS (iROAS) measures the return attributable only to the conversions the test proved wouldn't have happened anyway. Cost per incremental acquisition (CPIA) does the same work from the cost side, showing what each additional customer actually cost to acquire. These are the figures a finance team will sign off on, in a way platform-reported ROAS no longer earns.
Attribution asks which touchpoints a customer encountered before converting. Incrementality asks whether the advertising caused that customer to convert. The first question can be answered by tracking; the second can only be answered by comparison. The control group is what makes that comparison causal instead of descriptive. Without one, a report of what happened is just a report of what happened, with no way to know whether it would have happened regardless.
How the three measurement methods divide the work
Media mix modeling (MMM) handles portfolio-level allocation across channels, incrementality testing provides causal ground truth on specific questions, and MTA serves as a tactical signal for daily optimization inside channels already validated by the other two; the most defensible setups run all three in combination because no single method covers every blind spot in a measurement program.
MMM carries real value at the portfolio level, but it's built on correlation across historical data, and correlation can produce a confident, well-modeled channel ranking that is still wrong. The way teams catch that error is by feeding incrementality test results back into the model as Bayesian priors, which recalibrate the model's channel coefficients directly. Google's Meridian GeoX is built around exactly this loop. In one illustrative case, a geo-based incrementality test on Pinterest produced an iROAS materially below what the MMM had predicted for that channel. Instead of discarding the discrepancy, the team fed it back into the model as a calibration input, correcting the model's estimate of that channel's true contribution going forward.
Full-stack measurement platforms treat incrementality testing as one input among several, sitting alongside data integration and MMM output. The value of running all three isn't redundancy; each method illuminates a blind spot the others carry. A rough spend-tier guide helps teams size the investment to the budget: below a certain spend threshold, selective incrementality tests paired with standard attribution are usually enough. At mid-tier spend, add one or two incrementality tests a year focused on the largest channel. At the next tier up, bring in a proper MMM build. Above a significant level of omnichannel spend, run all three methods together, with the calibration loop connecting them.
Choosing the right test design for your channel and data environment
No single test design wins across every channel or data environment, and the choice follows from what signal a team can actually observe, not from which method sounds most rigorous on paper. Randomized controlled trials (RCTs) represent the conceptual gold standard: split the audience randomly into exposed and control groups, run the test for a set period, compare conversion rates. RCTs depend on user-level signal, and cookie blocking and the retirement of the Privacy Sandbox APIs have taken that signal away.
Geo holdout tests have become the default for most teams precisely because they sidestep that dependency. A geo holdout works the same way regardless of channel, whether the spend sits in Meta, Google, TikTok, a podcast buy, or out-of-home advertising, and it requires no user-level data. The method keeps advertising live in a set of matched test markets while suppressing it in matched control markets, then compares outcomes over the same window. Good geo holdout software finds markets that track each other closely, with the same seasonal peaks and the same baseline purchase rate, which lets any divergence visible during the test period be read as evidence of lift. Synthetic control modeling improves on simple matched-market pairs by building a composite holdout from several regions at once, which tends to produce more reliable reads and fewer false positives.
Platform-native audience holdouts, available through Meta Ads Manager and, for eligible accounts, through a Google representative, split a target audience into test and control using the platform's own user data at no added cost. They're useful for directional reads within that single platform, but they can't see cross-channel behavior, and the platform running the test is also the platform being graded. For teams that need a cookieless alternative without the market-matching work of a geo test, ghost bidding offers another option: the system bids on inventory for the control group without actually serving the ad, logging who would have been exposed and enabling a comparison without any user-level tracking.
Designing a valid geo holdout test: sample size, pre-period, and group separation
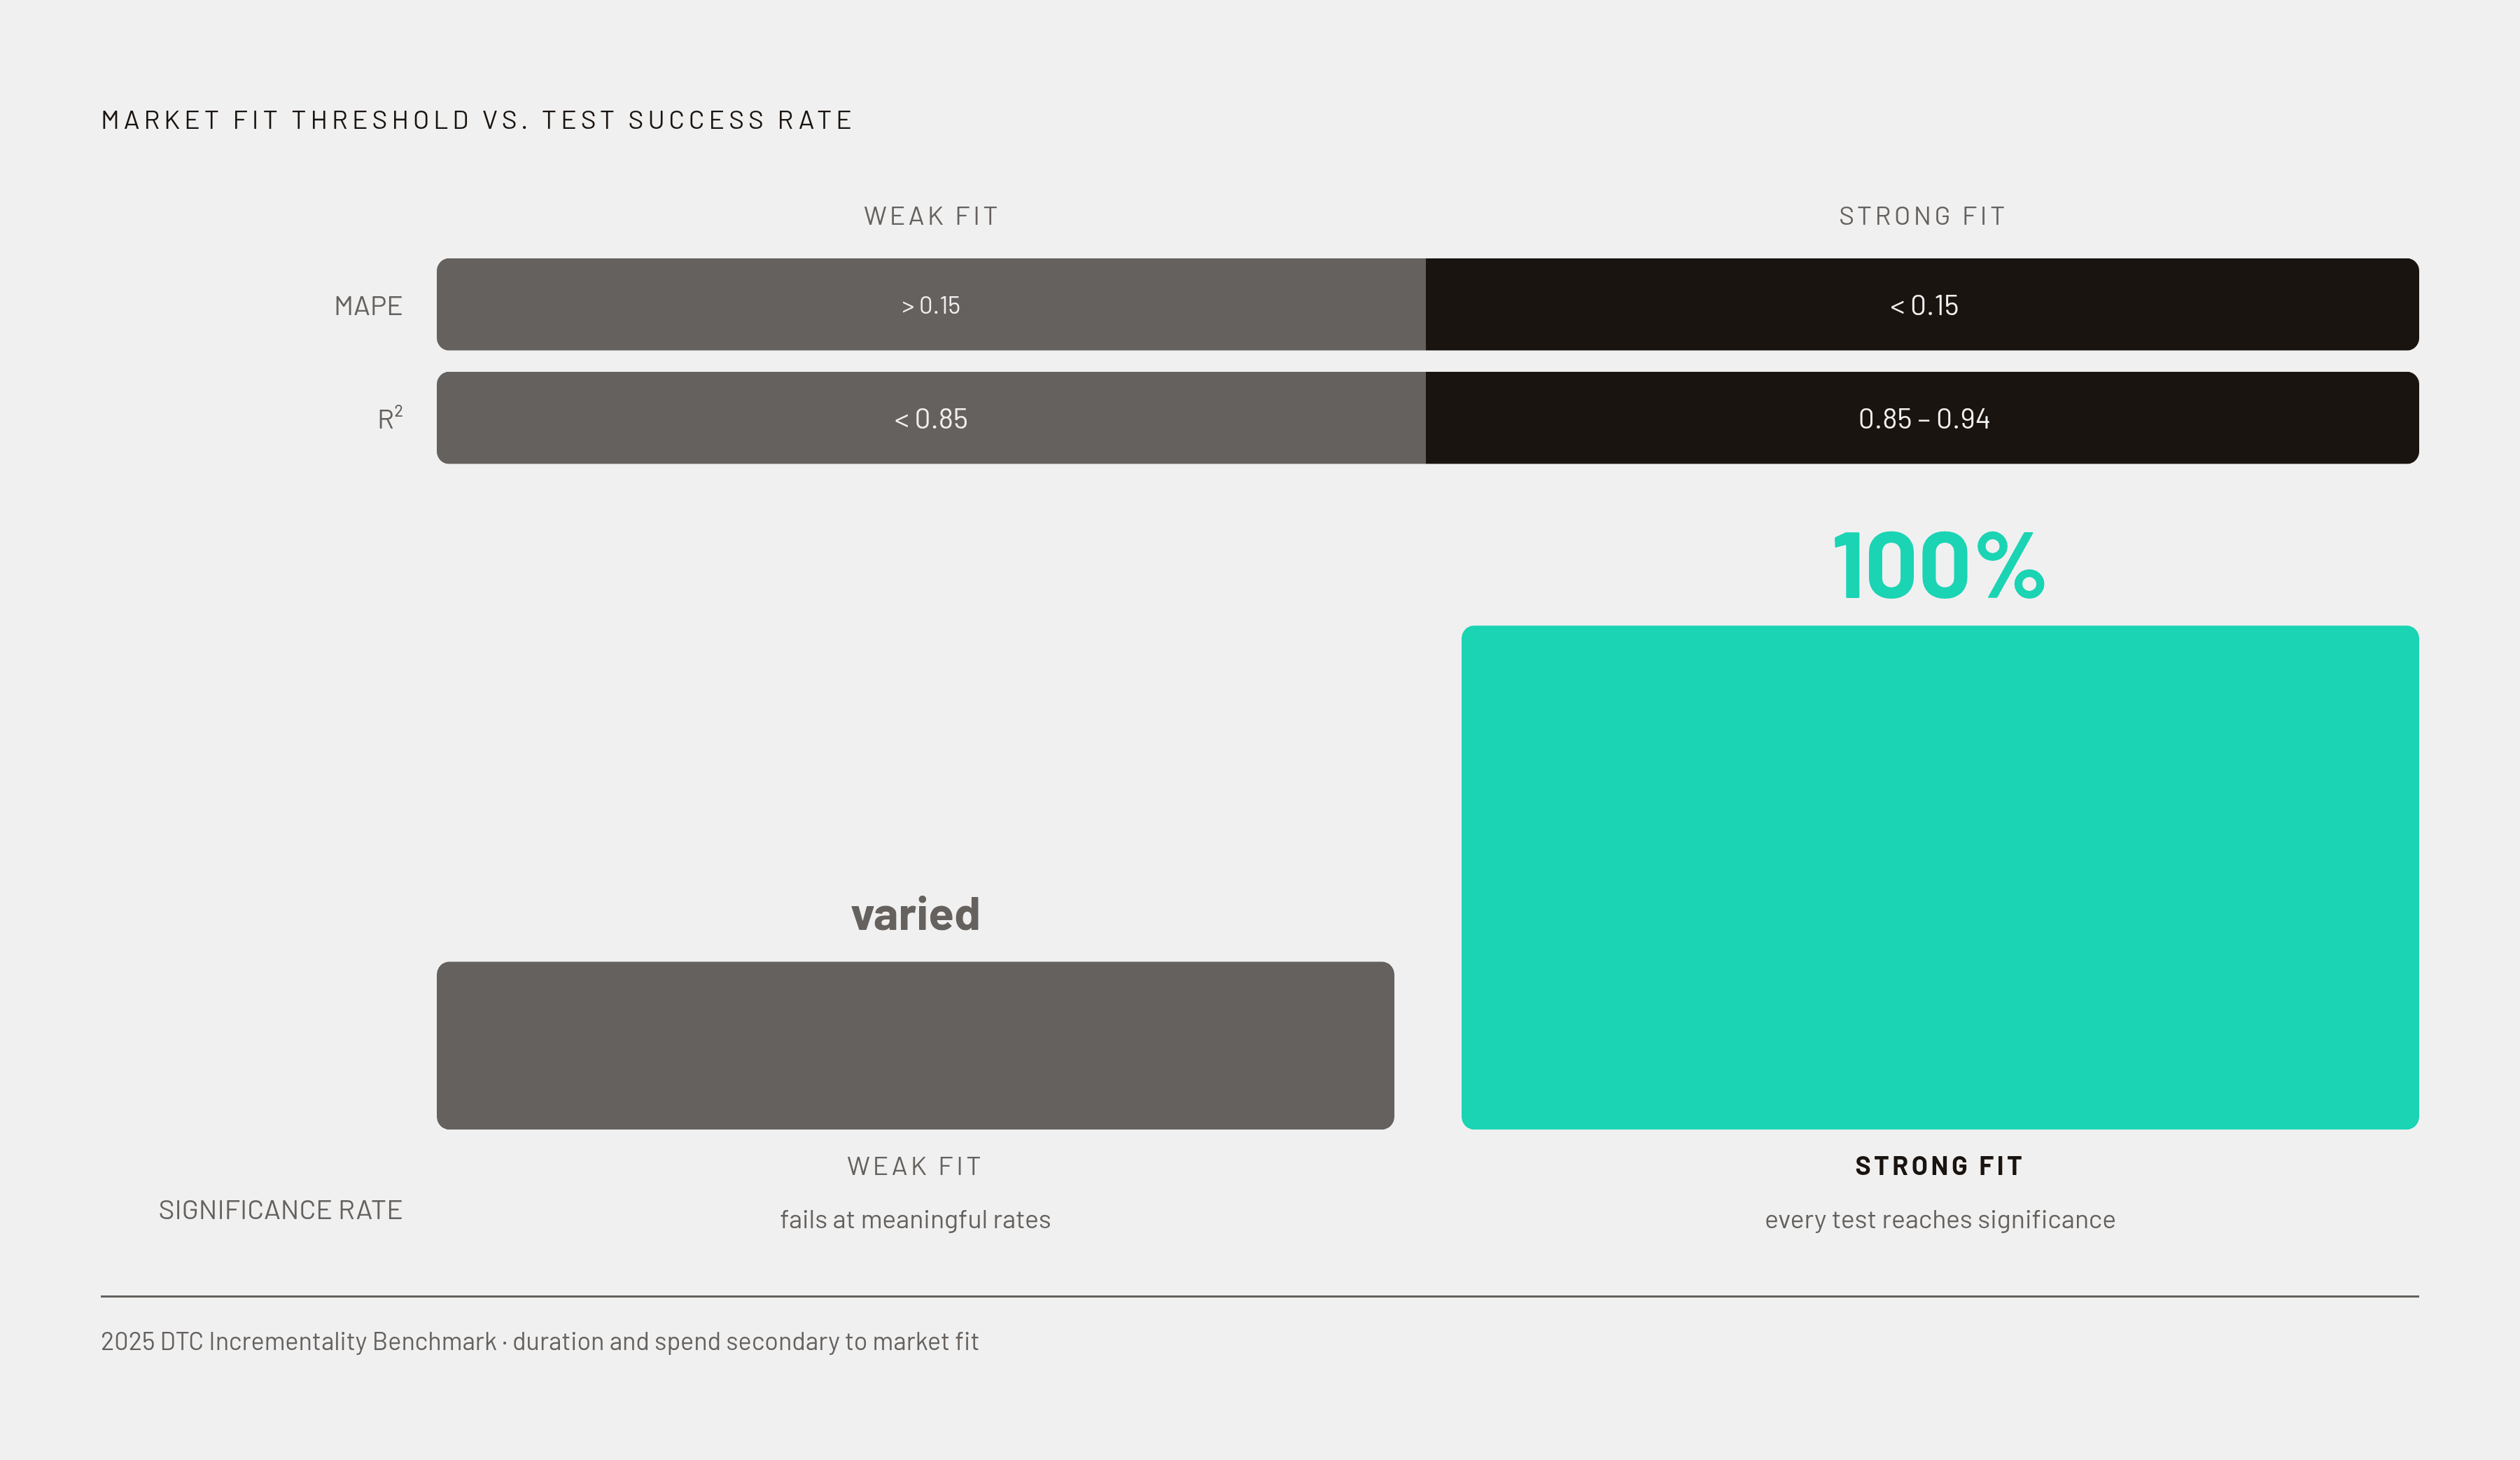
Market match quality predicts a successful test better than almost any other design choice a team makes. A well-matched pair of markets with a strong pre-period fit will outperform a longer, better-funded test that paired its markets poorly. DTC incrementality benchmarks from 2025 found that tests with a MAPE below 0.15 and an R² between 0.85 and 0.94 reached statistical significance 100% of the time, while tests with looser fit than that failed at meaningful rates regardless of how long they ran or how much budget backed them. Fit comes before duration and before spend in determining whether a test produces a usable result.
The pre-period, the stretch of time before the test begins, should run at least as long as the test period itself, and longer where possible, because it's what establishes the baseline the difference-in-differences analysis is measured against. Many teams default to a two-to-six-week test window, but duration shouldn't be assumed. It should be calculated from expected lift and conversion volume: higher-volume channels reach statistical significance faster, while smaller channels or longer purchase cycles need more time before the test can say anything with confidence.
Control group sizing follows a similar logic. The standard starting point sets a small control group against a large exposed group, sized to produce a statistically meaningful comparison while keeping the revenue sacrificed during the test window as small as it can be. A control group that falls too far below that threshold is unlikely to reach significance for most campaign sizes, no matter how the rest of the test is run. Suppressing ads across a meaningful share of markets for several weeks means giving up ad-driven revenue in those markets for the full window, and that cost needs sign-off from finance before the test launches, not after the invoice for lost revenue lands on someone's desk.
Audience spillover is the contamination risk that undoes the most carefully matched markets. Consumers don't respect market boundaries. A shopper who lives in a control market but commutes into a test market every day can still see the ads the test was supposed to withhold from them, and once that happens the control group is no longer clean. Market selection has to account for genuine geographic isolation, not just statistical similarity in past sales patterns. Shinola's own geo test illustrates the standard this work has to meet: market selection happened at the zip code level, specifically to keep the audience cells scientifically significant, and the holdout meant withholding media spend from a market chosen because it closely correlated with the test market, not one picked at random.
The AI bidding contamination problem that most test designs don't account for
Automated bidding systems create a contamination risk that most geo test designs don't anticipate. Performance Max and Meta Advantage+ are both built to continuously hunt for high-converting audiences and shift spend toward them, adjusting bids by geography within whatever boundaries an advertiser has set, including the geographies a test has designated as controls. When one of these systems reallocates spend into a market meant to be suppressed, the control group is compromised, and nothing in a standard campaign dashboard will flag it. The team running the test sees clean-looking reporting while the comparison beneath it stops meaning anything, because the contamination never appears in the dashboard.
This isn't a flaw that better monitoring alone fixes, because the same optimization logic that makes Performance Max and Advantage+ effective in live campaigns is what makes them a threat to a holdout test running alongside them. The fix has to be built into the campaign architecture before launch. Control markets need to be excluded at the campaign level, not the ad set level, since exclusions set at the ad set level leave the platform's bidding algorithm room to route around them. Broad-match or audience-expansion settings should be disabled for the campaign running during the test window, since both features are designed to find and shift toward high-converting audiences, which is precisely what a control group needs them not to do.
Running the test without interfering with it
A test that was well designed can still be ruined by what happens after it launches. Once a geo holdout or audience split is live, any mid-test change to creative, budget, targeting, or bid strategy breaks the comparison the test was built to produce, and the discipline of leaving it alone is what separates a usable result from measurement theater.
The full sequence runs in order: define the commercial hypothesis and the budget decision the test will inform, choose a method matched to the channel and the data available, design the test for adequate sample size and genuine group separation, launch it and leave it untouched, calculate lift and test it for significance, then convert the result into an actual budget move. The decision the test is meant to drive has to be agreed before launch, because a test that can't change where budget goes afterward isn't worth running. One example shows why that commitment matters: a health brand spending seven figures a month across Meta and Google ran an incrementality test and found that cutting spend by a substantial margin had no negative effect on conversions. Because the decision rule had been set before the test began, the brand could act on that finding immediately, reallocating or simply saving the budget the test had proven unnecessary.
Contamination signals, geo spend distribution and platform AI reallocation among them, still need watching throughout the test window, but they're diagnostic tools, not levers to pull mid-run. If contamination occurs, the right response is to document it and plan a rerun, not to patch the live test and hope the fix holds.
Reading the results: what lift numbers mean
A lift result is a causal estimate with a margin of error attached to it, not a precise measurement of a fixed truth. The confidence interval around the number matters as much as the number itself, and a result that points in a positive direction without reaching statistical significance is not a signal to scale spend.
The math that turns a significant result into a budget figure runs straightforward: incremental conversions equal the exposed group's total minus the control group's baseline; multiply that by average order value to get incremental revenue; divide that incremental revenue into media spend to get iROAS. This figure holds up where platform ROAS doesn't, because the control group isolates what would have happened without the spend, rather than attributing credit across touchpoints that may or may not have mattered.
The calibration step closes the loop with MMM. Compare the test's iROAS against what the model had predicted for that same channel. The gap between the two is the model's error, and that gap becomes a Bayesian prior that recalibrates the model for the next round of budget planning. The Pinterest case from earlier shows the mechanism directly: the geo test's iROAS came in materially below the MMM's prediction, and that delta went back into the model as a calibration input rather than getting set aside as an inconvenient outlier.
What a lift result can't do is speak beyond its own conditions. It measures the effect of a specific campaign, a specific creative, a specific spend level, and the market conditions that held during the test window, and it carries confidence only within those bounds.